Market Recovery Program
It's legal, it works, and it's guaranteed!
Chapter 7
SOMETHING MAGICAL
What’s a Compound Interest Rate chart?
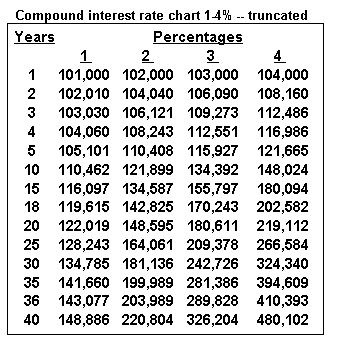
A Compound Interest Rate chart tells us how money grows, over time, at different annual rates of compound interest.
What’s the difference between Simple and Compound Interest?
Simple interest is interest only on principal; Compound Interest is interest on principal and interest already earned.
The chart in Figure 5 is a truncated version of a much larger chart found in the Appendix at the back of this book (see Appendix A -- Compound interest on $100,000)
This chart tells us how $100,000 will grow over time at interest rates ranging from 1-4%.
Figure 5
I suppose that this chart will confirm the Rule of 72 from the last chapter? If so, we should be able to verify whether the $100,000 doubles every 18 years under the “4%” column…
Let’s check it out.
Looking under the 4% column and
BACK TO TABLE OF CONTENTS NEXT CHAPTER
---
